• Home

chartprofit.com

Daily analysis - Stock Market, Bonds, Forex and more

E-mini S&P 500 futures ESM25 23rd May 2025

Posted on May 23, 2025 Written by Chart Prophet

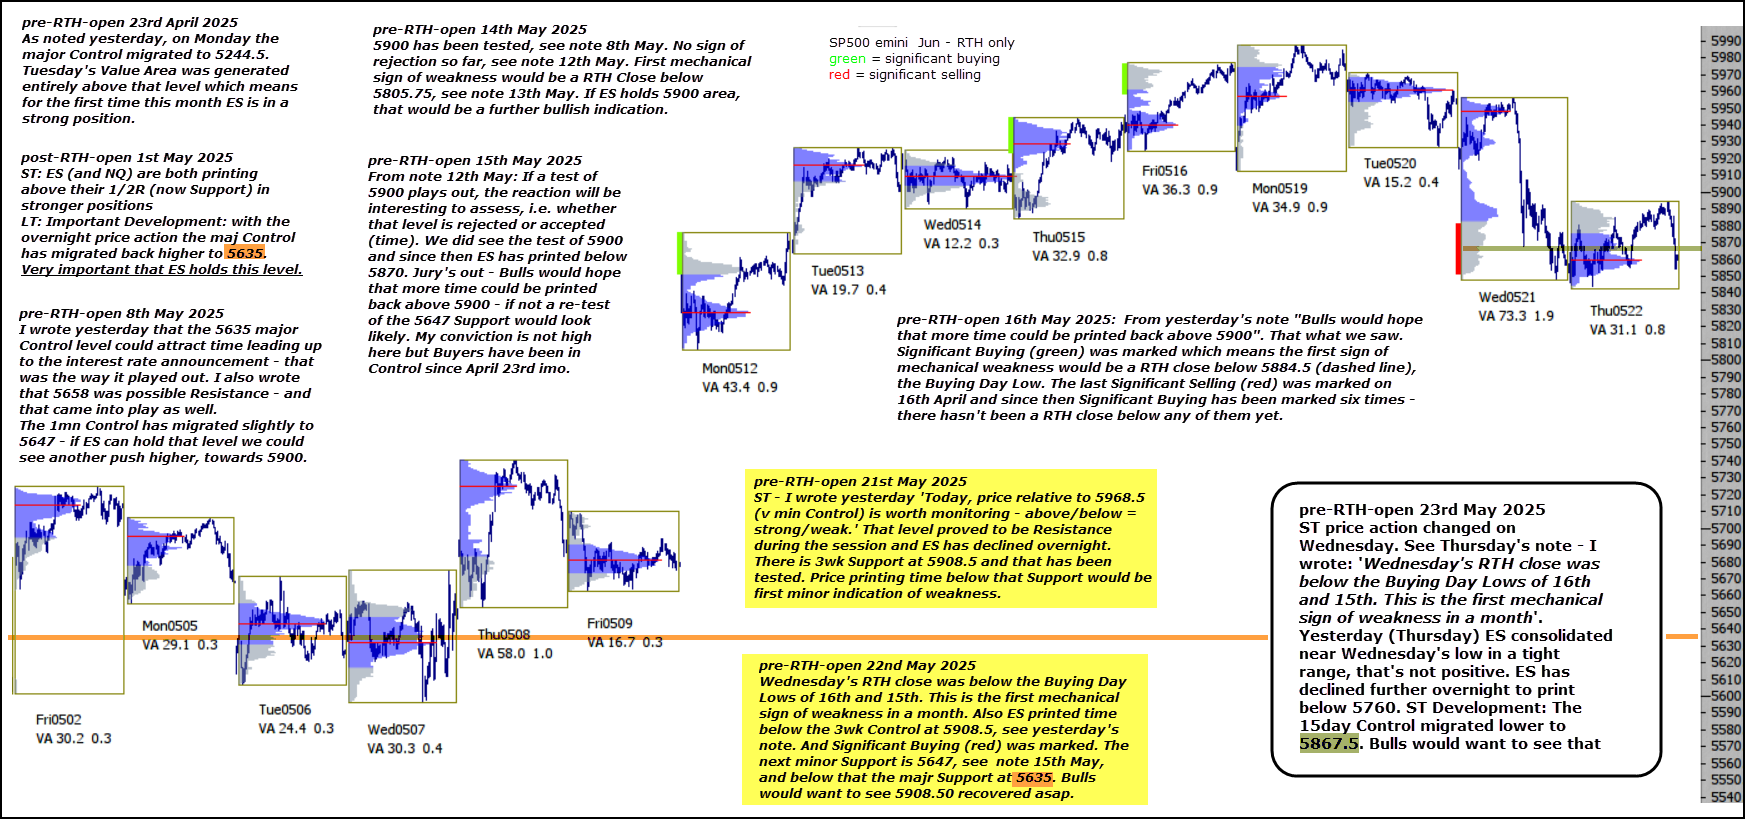
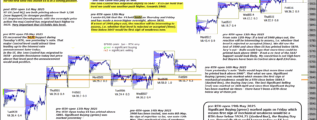
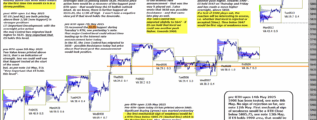
ST price action changed on Wednesday. See Thursday’s note – I wrote ‘Wednesday’s RTH close was below the Buying Day Lows of 16th and 15th. This is the first mechanical sign of weakness in a month‘.

Yesterday (Thursday) ES consolidated near Wednesday’s low in a tight range, that’s not positive. ES has declined further overnight to print below 5760.

read this post on Substack and sign-up for free newsletter

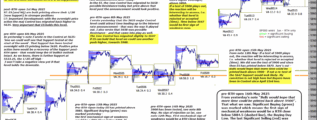
ST Development: The 15day Control migrated lower to 5867.5. Bulls would want to see that level recovered asap.

Filed Under: emini SP500 (ES)

E-mini S&P 500 futures ESM25 22nd May 2025

Posted on May 22, 2025 Written by Chart Prophet

Tuesday’s RTH close was below the Buying Day Lows of 16th and 15th. This is the first mechanical sign of weakness in a month. Also ES printed time below the 3wk Control at 5908.5, see yesterday’s note. And Significant Buying (red) was marked.

read this post on Substack and sign-up for the free newsletter

The next clear Support is 5647, see note 15th May. Bulls would want to see 5908.50 recovered asap.

Filed Under: emini SP500 (ES)

E-mini S&P 500 futures ESM25 21st May 2025

Posted on May 21, 2025 Written by Chart Prophet

I wrote yesterday 'price relative to 5968.5 (v min Control) is worth monitoring - above/below = strong/weak.' read this post on Substack That level proved to be Resistance during the session and ES has declined overnight. There is 3wk Support … [Continue reading]

Filed Under: emini SP500 (ES)

Buyers in Control on Monday

Posted on May 20, 2025 Written by Chart Prophet

I wrote yesterday 'First sign of mechanical weakness would be a RTH close below 5924.75 (dashed line), Friday's Buying Day Low'. ES recovered strongly from a weak Open. I also wrote 'Otherwise I stay positive, even ST'. ES recovered strongly from a … [Continue reading]

Filed Under: emini SP500 (ES)

E-mini S&P 500 futures ESM25 19th May 2025

Posted on May 19, 2025 Written by Chart Prophet

Significant Buying (green) marked again on Friday which means first sign of mechanical weakness would be a RTH close below 5924.75 (dashed line), the Buying Day Low. Potentially that could happen today as ES has printed below 5900 overnight. … [Continue reading]

Filed Under: emini SP500 (ES)

E-mini S&P 500 futures ESM25 16th May 2025

Posted on May 16, 2025 Written by Chart Prophet

From yesterday's note "Bulls would hope that more time could be printed back above 5900". That what we saw. Significant Buying (green) was marked which means the first sign of mechanical weakness would be a RTH close below 5884.5 (dashed line on … [Continue reading]

Filed Under: emini SP500 (ES)

SP500 Weekly chart updated

Posted on May 15, 2025 Written by Chart Prophet

Updating the post Relative Strength Index diverging on Weekly Charts published 1st October. Updated chart below. The first ‘divergent’ lower high on the oscillators was in the middle of 2024 and preceded a mild sell-off. You had to wait more than … [Continue reading]

Filed Under: emini SP500 (ES)

E-mini S&P 500 futures ESM25 15th May 2025

Posted on May 15, 2025 Written by Chart Prophet

From note 12th May: If a test of 5900 plays out, the reaction will be interesting to assess, i.e. whether that level is rejected or accepted (time). We did see the test of 5900 and since then ES has printed below 5870. Jury's out - Bulls would … [Continue reading]

Filed Under: emini SP500 (ES)

S&P 500 E-mini target hit – what’s next?

Posted on May 14, 2025 Written by Chart Prophet

5900 has been tested, see note 8th May. No sign of rejection so far, see note 12th May. First mechanical sign of weakness would be a RTH Close below 5805.75, see note 13th May. If ES holds 5900 area, that would be a further bullish … [Continue reading]

Filed Under: emini SP500 (ES)

E-mini S&P 500 futures ESM25 13th May 2025

Posted on May 13, 2025 Written by Chart Prophet

Pre-RTH-Open today ES has printed above 5885. Significant Buying (green) was marked yesterday - the first mechanical sign of weakness would be a RTH Close below 5805.75 which is the Buying Day Low. Read this post on Substack Also, please … [Continue reading]

Filed Under: emini SP500 (ES)

  • 1
  • 2
  • 3
  • …
  • 537
  • Next Page »

Archives

Copyright © 2025 · Focus Pro Theme on Genesis Framework · WordPress · Log in